Why Data Format Matters in Ultrasonic Testing
In ultrasonic testing (UT), the value of an inspection depends on how data is captured and displayed. Two inspections using the same equipment can produce very different outcomes if the wrong data format is selected.
B-scan and C-scan are the most common UT data views used today. Each format serves a specific purpose. Choosing the right one helps inspection teams interpret results faster, reduce ambiguity, and support confident decisions.
As ultrasonic testing in 2026 continues to evolve, understanding data formats has become just as important as understanding the tools themselves.
What Is a B-Scan in Ultrasonic Testing?
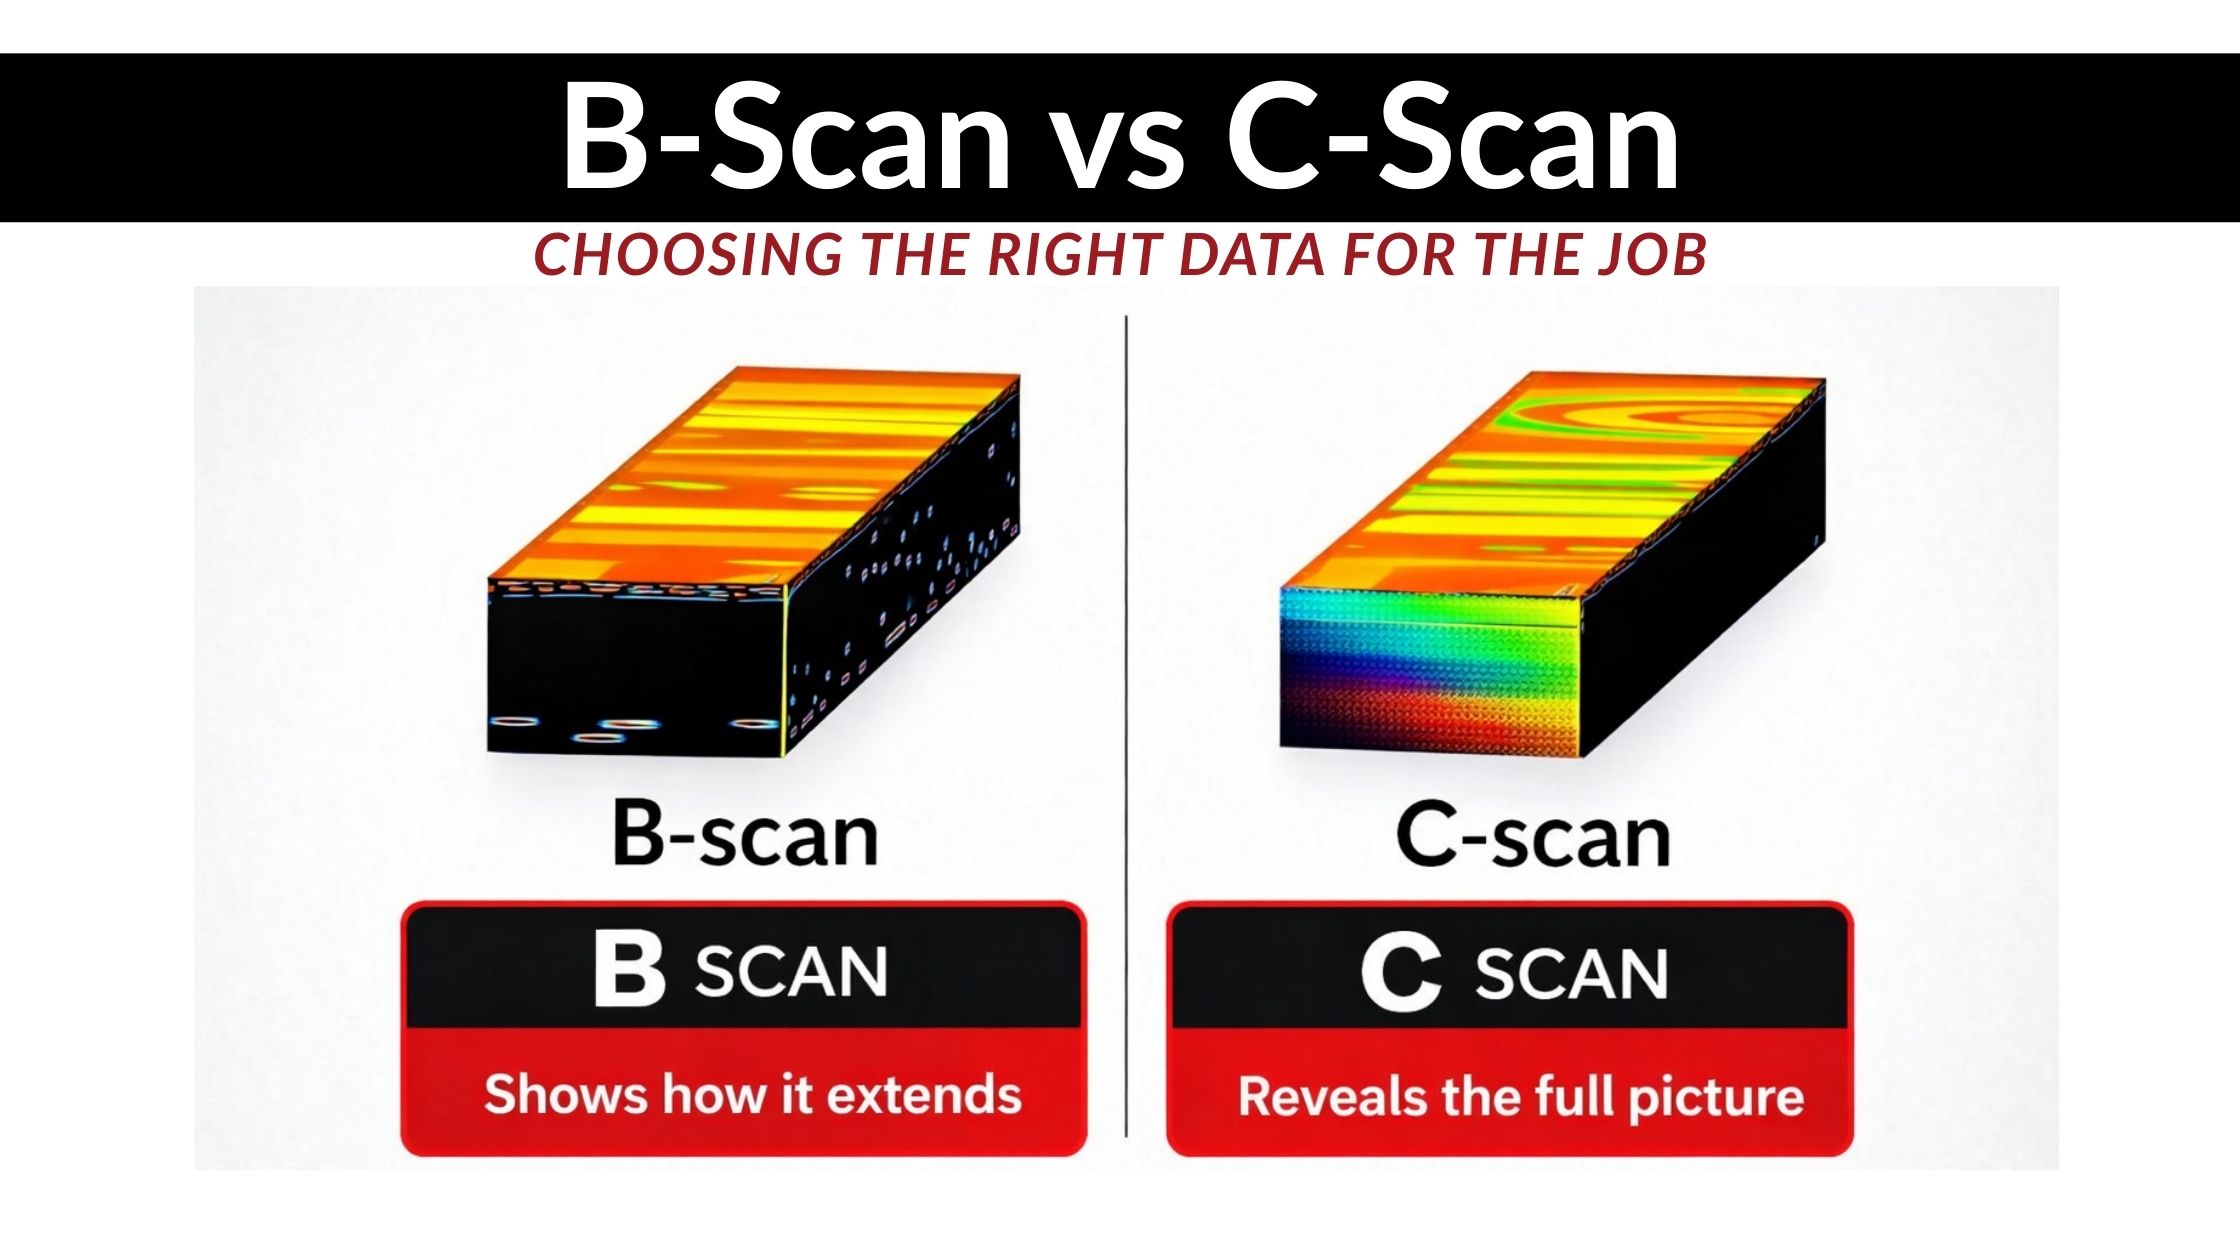
A B-scan provides a cross-sectional view of the inspected material. It is created by moving a probe along a single scan path while capturing depth information at each position.
The result looks like a slice through the component. Depth is shown on one axis, while probe movement appears on the other.
Line-by-Line Cross-Sectional Clarity
B-scans excel at showing how thickness or internal features change along a defined path. This makes them useful for:
- Wall thickness profiling
- Weld inspection
- Localized corrosion assessment
- Defect sizing and depth verification
Because B-scans show depth directly, they help inspectors understand how severe a condition is at a specific location. However, they only represent the area along the scan line—not the full surface.
What Is a C-Scan in Ultrasonic Testing?
A C-scan provides a plan view of the inspection area. Instead of showing depth slices, it maps conditions across the surface using X-Y coordinates.
Each data point appears as a pixel, often displayed as a color map that highlights changes in thickness or signal response.
Plan View, Area-Based Insight
C-scans are ideal for visualizing patterns and trends across large areas. Common applications include:
- Corrosion mapping
- Tank floor inspections
- Vessel wall assessment
- Large-area screening
This format makes it easy to identify affected zones quickly. However, C-scans alone may not provide enough depth detail to fully characterize a flaw.
Choosing Between B-Scan and C-Scan
Selecting the right format depends on inspection goals, not personal preference.
When a B-Scan Makes Sense
- Depth accuracy is critical
- The inspection follows a defined path
- Flaw sizing or wall loss profiling is required
When a C-Scan Makes Sense
- Full-area coverage is needed
- Pattern recognition matters
- Corrosion distribution must be visualized clearly
In many real-world inspections, teams use both formats together. A C-scan identifies where issues exist, while a B-scan confirms depth and severity.
The right combination improves clarity and reduces interpretation risk.
Hybrid Approaches Are Becoming the Standard
Modern inspection workflows increasingly blend B-scan and C-scan data. Encoded scanning and automated acquisition allow both views to be captured during the same inspection.
This approach improves efficiency and reduces guesswork. It also aligns well with automated ultrasonic scanning systems, which support consistent motion and structured data capture.
Hybrid data sets also support better reporting, traceability, and long-term comparison.
Data Quality Still Determines the Outcome
Regardless of format, poor data quality undermines inspection results. Surface preparation, alignment, and motion control still matter.
Without disciplined workflows, neither B-scan nor C-scan data will be reliable. Teams that struggle with interpretation often trace the issue back to data quality—not software or format choice.
For a deeper look at this challenge, see:
👉 Why Data Quality Still Fails Most Inspections (and How to Fix It)
How Data Format Impacts Inspection Decisions
Choosing the correct data format shortens evaluation cycles. It also improves communication between inspectors, engineers, and asset owners.
Teams that understand manual vs automated UT scanning often make better data format decisions as well.
The result is faster interpretation, clearer reporting, and stronger confidence in outcomes.
Next Steps for Data-Driven UT Inspections
Selecting the right data format is a strategic decision. It affects inspection clarity, reporting quality, and long-term asset management.
To explore the right scanning approach and data workflow:
- Review your inspection objectives
- Match data format to decision needs
- Evaluate automation where consistency matters
For guidance on optimizing UT workflows and data capture, contact the ScanTech team to review inspection requirements and available solutions.