Ultrasonic Testing (UT) is a cornerstone of non-destructive testing (NDT), but understanding the output visuals can be challenging if you’re not familiar with how B-scan and C-scan data work. Both formats offer critical insights—but they serve different purposes.
In this guide, we’ll break down the key differences between B-scan and C-scan displays, how to interpret each, and when to use them in the field.
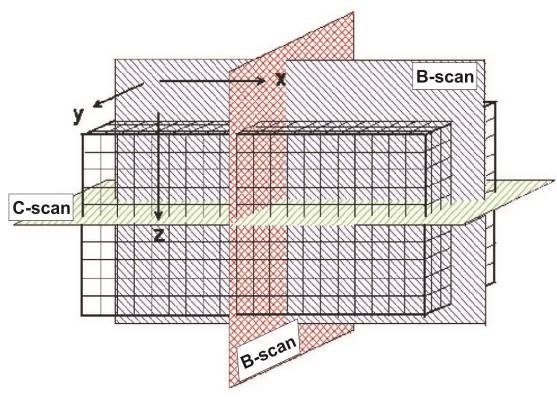
What Is a B-Scan?
A B-scan (or “brightness scan”) is a cross-sectional view of the material being inspected. Think of it like a side profile or “slice” through a tank wall or pipe.
- X-axis: Scan path or position along the surface
- Y-axis: Thickness or depth
- Color/Grayscale: Echo signal strength or amplitude
How to Read It:
- The top of the image is usually the front surface of the material.
- The bottom line (back wall) represents the total thickness.
- Any discontinuity—like a crack or thinning wall—will show up as a mid-wall indication or irregular contour.
When to Use It:
- For tank floor or vertical wall thickness profiling
- When you need a side view of the material’s integrity
- For generating real-time feedback during manual inspections
Pro tip: B-scan is best for measuring thickness and visualizing metal loss in a straight line or scan pass. It’s ideal for mapping corrosion across weld seams or shell courses.
What Is a C-Scan?
A C-scan offers a top-down view of the area under inspection, like looking at a heat map from above.
- X-axis / Y-axis: Physical layout of the scan area
- Color coding: Corresponds to remaining wall thickness or defect amplitude
How to Read It:
- Each color block or pixel represents a single data point from the scan grid.
- The colors indicate varying material thickness—often in real-time using software like Analyst™ XR.
- Areas of concern (corrosion, thinning) will appear in hot colors like red or orange.
When to Use It:
- For full-area corrosion mapping on tanks, vessels, or large-diameter pipe
- To detect trends and deterioration patterns
- For visual reporting and archiving using code-driven tools like API 653 or ASME B31G
Pro tip: C-scan offers the big picture, making it ideal for spotting high-risk zones or tracking degradation over time. It’s also perfect for use with ScanTech’s XR and Vertex scanners equipped with Analyst™ XR software.
B-Scan vs. C-Scan: Key Differences
| Feature | B-Scan | C-Scan |
|---|---|---|
| View Type | Cross-sectional (side view) | Planar (top-down view) |
| Best For | Thickness profiling | Full-area corrosion mapping |
| Resolution | Medium | High (grid-based) |
| Data Output | Line scan | 2D map |
| Use Case Example | Tank wall welds | Tank floors and pipe elbows |
Why It Matters for Field Work
Choosing the right scan type can make or break an inspection. For example:
- If you’re doing a quick check on wall loss? → Use B-scan.
- Need to assess full corrosion zones and report for compliance? → Use C-scan.
Each delivers actionable data—but only when used in the right context with the right tools.
Final Thoughts: Precision Drives Decisions
Understanding the difference between B-scan and C-scan isn’t just academic. It’s essential for getting accurate, repeatable, and compliance-ready results in ultrasonic testing.
Whether you’re mapping wall loss in a paper dryer or verifying corrosion in a petrochemical tank, interpreting the scan correctly means safer assets and smarter calls in the field.
Internal Resources You Might Like:
- Choosing the Right Ultrasonic Testing Equipment: A Buyer’s Guide
- Why Data Quality Is Everything in NDT
- How ScanTech Scanners Overcome Real-World Inspection Challenges
Need help selecting a system for B-scan or C-scan workflows?
Explore our full lineup of ultrasonic scanners or get in touch with our team.